UNEX
United Natural EXperiments
UNEX is a program for performing GED studies.
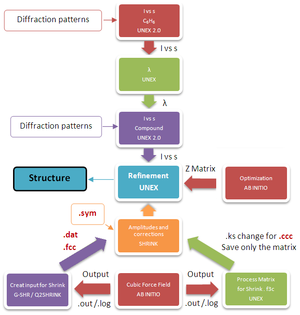
Typical Analysis of GED diffraction patterns
For the analysis of GED diffraction patterns five programs are needed: Unex, Unex 2.0, G-SHR, Gaussian and Shrink. Since not all their manuals are available, here, it is explained how to run these programs, how to create their inputs and how to analyze their outputs.
These instructions are not always sufficiently complete; in some cases more calculations will be required.
Only the important part of the different calculations will be shown.
Find the center of the diffraction patterns
Program: GIMP (all platforms)
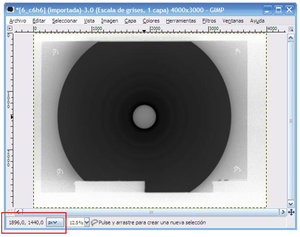
It is necessary to know the approximate center of each diffraction pattern in pixels units; this information can be found simply by placing the mouse in the center of the image. Values will be shown at the left bottom of the screen.
Determination of the I vs s curve for the reference substance
Program: UNEX 2.0 (all platforms)
For the substance used as a reference, I vs s curves must be calculated for every measurement. This information is necessary to determinate λ.
INPUT
The input must contain the following information:
- Diffraction pattern`s center (Found with Gimp), variables: 'Xc' and 'Yc'
- Resolution of the diffraction pattern (generally 508.0=x=y), variables 'XResolution' and 'YResolution'
- Distance from nozzle to Plate (250.0 mm or 500.0 mm), variable 'NozToPlate'
- Inner and outer radio of the diffraction pattern:
For N-P=250.0 mm: 12.0 - 68.0: For N-P=500.0 mm: 8.0 – 68.0, variables 'IntRfr' and 'IntRto'
- A first approximation of lambda (λ= 0.048 can be used), variable 'IntLambda'
add=base,<BASE>,</BASE>
add=image,"outputimagename",<image>,</image>
intscan="outputimagename"

<BASE>
;WriteAsymBgLImg=1
WriteWeightsImg=1
</BASE>

<image>
file="inputimagename".tif
Xc=1880
Yc=1440
XResolution=508.0
YResolution=508.0
NozToPlate=250.0
IntRfr=12.0
IntRto=68.0
IntStep=0.2
IntLambda=0.048
DensCalcMethod=3
IntDerMethod=2
GintNbglx=5
GintNbgly=4
</image>
The variables written in "" have to be adjusted to the real input image name and the desired output image name, respectively.
OUTPUT
The most important information contained in this output is shown in a table with three columns, which correspond to the values of s, Intensity and error, respectively. Besides the output, two more files will be created by UNEX 2.0:
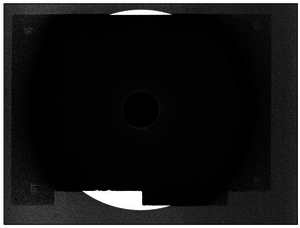
- A black and white image with extension .tif, that simply serves to see which points were analyzed from the diffraction pattern and which were not. The points that could not be analyzed by UNEX 2.0 are shown in white. The points that were analyzed without problems will be marked in black.
- A curve that shows Intensity as function of s.
Sector, pixels: (1847,1441)  error: (1,1)
Misalignment, mm: 0.050469  error, mm: 1.0278e-05

Xc,Yc,Xs,Ys correlations:
-----------------------------------
Xc      Yc      Xs      Ys
-----------------------------------
Xc   1.0000
Yc  -0.0063  1.0000
Xs   0.8553 -0.0084  1.0000
Ys  -0.0084  0.8430 -0.0157  1.0000
-----------------------------------

Applying flatness correction: sec(Theta)
Applying C2T correction: sec(Theta)^2

Obtained intensity curve for Gdata set [img12_gdata1]
-----------------------------------------------------
S, A^(-1)    |     Intensity     |      Error
-----------------------------------------------------
6.1942710866        1.6464781919        0.0054656150
6.2457998893        1.5893822958        0.0042375636
6.4518925255        1.4469784894        0.0041903994
6.5034099493        1.4142242404        0.0041815613
.........................................................
33.6754733591        0.4619937061        0.0016916365
33.7232676785        0.4619655685        0.0016889816
34.1529321800        0.4624714632        0.0016700908
34.2006186532        0.4568536624        0.0023469826
------------------------------------------------------
Determination of the wave length, λ
Program: UNEX (all platforms)
INPUT
This input needs all measurements of the reference compound. Each measurement is called a-b, where "a" can be 1 or 2 and indicates the NP distance (1 and 2 are equivalent to 250.0 cm and 500.0 cm respectively), b indicates the number of the experiment for each "a" value, so the third measurement with NP = 250.0 cm is called 1-3.
UNEX has the structural information of reference compound; that’s why only the name of the reference compound must be clarified.
For each experiment it is necessary to know the following data:
- s and I columns (obtained with UNEX 2.0, without the error column),
- λ approximation that was used in UNEX 2.0 (0,048),
- NP distance,
- The distance between the sector and the photographic plate.
BASE=BASE,<BASE>,</BASE>
INT=INT,<INT>,</INT>
SECTOR=R3DIV,<SECR>,</SECR>
SECTOR=REGSEC,<SECR>,</SECR>

STANDARD=1-1,1-2,2-1
PRINT=RINT,BGL,SMS,TSMS,DSMS
PRINT=SECTOR

STOP

<BASE>
;StdPrintFinBgl=1
StdSecRegNum=100.0
StdBglPolPow=4
StdFindFinLambda=1
;StdVarSector=0
StdMaxIter=50000
StdScaVecNorm=0.0000000001
StdLamVecNorm=0.0000000001
StdSecVecNorm=0.0000000001
StdBglVecNorm=0.0000000001
</BASE>

<INT>
; Intensity obtained using Fuji formula and intensity calibration.
INT1  Lam=0.0480  NtoP=250.0 Std=C6H6  StoP=4.5  Nbgl=5
    6.1942710866        3.7961154844
    6.2457998893        3.6993695135
................................................
   34.1052348712        0.9419257424
   34.1529321800        0.9392391583
   34.2006186532        0.9471865375
INT1  Lam=0.04850  NtoP=250.0  Std=C6H6  StoP=4.5  Nbgl=5
    6.1942710866        1.6464781919
    6.2457998893        1.5893822958
    6.2973264529        1.5640692050
............................................
   34.1052348712        0.4590509645
   34.1529321800        0.4624714632
   34.2006186532        0.4568536624
INT2  Lam=0.0480  NtoP=500.0  Std=C6H6  StoP=4.5  Nbgl=4
    4.1314936804        3.5307314405
    4.1830969808        3.4776386519
    4.2346987782        3.4050651101
.........................................
   34.1052348712        1.4854210318
   34.1529321800        1.4890378845
   34.2006186532        1.4967659841
</INT>

<SECR>
8.250		1.8684053318
8.500		1.7616089813
...................................
67.500		0.7832685062
67.750		0.7829264979
68.000		0.7827145884
68.250		0.7826424866
</SECR>
OUTPUT
The second output contains the following information:
- λ
- RINT= Reduced intensity: Intensity/Sector Function
- BGL= Backgroundline: Itot = Im + Ia + B
- SMS= Experimental molecular intensity; SMS=Im.s/Itot
- TSMS= Theoretical molecular intensity
- DSMS= Difference between TSMS y SMS
- SECTOR= Sector Function
Final info about each curve:
------------------------------------------------------------------------------
(1-1):[ CCl4 ]: Lam=0.048887 (Rs=8.8916) (Opt:Ri=0.1512 Rs=11.0162) (mt=81.9972) (bt=66.1255)
(1-2): [ CCl4 ]: Lam=0.048875 (Rs=6.3165) (Opt: Ri=0.0951 Rs=7.0270) (mt=170.4953) (bt=137.8114)
(1-3): [ CCl4 ]: Lam=0.048864 (Rs=6.3074) (Opt: Ri=0.1301 Rs=7.1384) (mt=254.9691) (bt=204.1727)
(1-4): [ CCl4 ]: Lam=0.048903 (Rs=8.7300) (Opt: Ri=0.1477 Rs=11.8938) (mt=101.7904) (bt=80.2636)
(1-5): [ CCl4 ]: Lam=0.048831 (Rs=8.0108) (Opt: Ri=0.1271 Rs=9.2283) (mt=355.5708) (bt=278.2735)
(1-6): [ CCl4 ]: Lam=0.048922 (Rs=5.7268) (Opt: Ri=0.1296 Rs=6.9098) (mt=147.7279) (bt=115.1810)
(1-7): [ CCl4 ]: Lam=0.048898 (Rs=6.8359) (Opt: Ri=0.1614 Rs=8.4400) (mt=218.8298) (bt=172.1665)
------------------------------------------------------------------------------
StandardStandardStandardStandardStandardStandardStandardStandardStandardStanda
GED curves.
 ------------------------------------------------------------------------------------
       S     |   Red. Int. |  Background | Exp. sM(s) |  Thr. sM(s) | DeltasM(s) |
 ------------------------------------------------------------------------------------
 ==============================================================================
 Curve: (1-1) Scale=1.000000 VarScale=Yest=66.125546
              NtoP=250.000000 StoP=4.500000Lam=0.048887 Std=CCl4
 ==============================================================================
   6.18570878     1.12531380    0.30248099  -1.09590469   -1.11257191    0.01666722
   6.28389463     1.15238288    0.30449920  -0.95588297   -0.95580452   -0.00007844
....................................................................................
  29.25938439     1.55067509    0.54994853    0.02125867    0.15660506  -0.13534639
  29.35757024     1.55371634    0.55005979    0.10734745    0.12648838  -0.01914094
  29.45575609     1.55128463    0.55017105    0.03280147    0.09297429  -0.06017282
 ==============================================================================
....................................................................................

==============================================================================
 Curve: (1-6) Scale=1.000000 VarScale=Yest=115.181020
              NtoP=250.000000 StoP=4.500000Lam=0.048922 Std=CCl4
 ==============================================================================
   6.18123788     1.15501381    0.33704502  -1.12517825   -1.11815525   -0.00702300
   6.27935277     1.18287168    0.33943961  -0.98314529   -0.96434748   -0.01879780
   6.37746766     1.22108063    0.34183420  -0.77010203   -0.75532093   -0.01478110
....................................................................................
  29.33635123     1.58205421    0.57940733    0.07764965    0.13335760  -0.05570795
  29.43446612     1.58251049    0.57950170    0.08856227    0.10037910  -0.01181683
 ==============================================================================
 Curve: (1-7) Scale=1.000000 VarScale=Yest=172.166536
              NtoP=250.000000 StoP=4.500000Lam=0.048898 Std=CCl4
 ==============================================================================
   6.18428318     1.13354848    0.31670741  -1.13270667   -1.11436755   -0.01833911
   6.28244641     1.16539764    0.31895807  -0.96473514   -0.95854143   -0.00619372
   6.38060963    1.19998951    0.32120874  -0.77345258   -0.74790300   -0.02554958
   6.47877286     1.24478043    0.32345774  -0.50973241   -0.49880685   -0.01092555
...................................................................................
  29.44896754     1.58226430    0.58086799    0.04112012    0.09534062  -0.05422049
 ------------------------------------------------------------------------------------

 Sector function:
 ----------------------------------------------------
      r, mm   |    R3Div   |    Total  |   Error
 ----------------------------------------------------
    11.825810     1.138196     0.012535     0.001047
    12.295956     1.112335     0.013770     0.000770
    12.860263     1.086966     0.015395     0.000657
.....................................................
    57.301787     0.793921     0.994685     0.000817
    57.401324     0.794018     1.000000     0.000792
 ----------------------------------------------------
Determination of the I vs s curve for the studied compound
Program: UNEX 2.0 (all platforms)
This calculation is very similar to the one developed for the reference compound, except that in this stage the diffraction patterns of the studied compound and the calculated wavelength must be used.
The wavelength that should be used is the average between all the wavelengths that were obtained for a given NP distance.
Calculation of the Cubic Force Field
Program: Gaussian (all platforms), G-SHR or Easyinp (Windows), Q2Shrink (Linux)
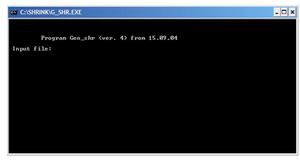
Shrink cannot read Gaussian’s outputs, that’s why these outputs should be rearranged using a program called G-SHR.
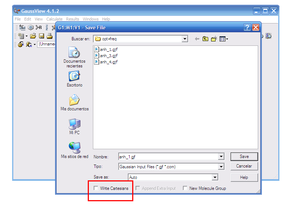
It is important to have Gaussian’s output and this program (G-SHR) in the same folder.
The calculation is very fast, and when it´s completed two files with different extensions are created: .dat and .ffc.
Q2Shrink only produces the .dat file. The .ffc file contains a section from the Gaussian output which has to be extracted and rearranged, e.g. using a shell script. Q2Shrink is not able to work with linear molecules, whereas Easyinp produces the necessary dummy atoms automatically.
The .dat file is the input for Shrink [1]. It shows the vibracional internal coordinates (just before displaying the temperature). The temperature must be correct, by default it is 300K. In order to run the .dat file with Shrink, to sentences must be added:
- refin1
- anharm
form
  -4
rothz
refin1
anharm
modes
distr
freq
  5.
data
    Title of the job:.....
   'C1'   0   13    0   0
      6  13    0    0   6
      5   5    1    0   2
    0   13*1  0


     'Cl1'    34.9688500000     1.3433460000      .9563950000       .0000000000
      'C2'    12.0000000000     -.3923880000      .9610780000       .0000000000
      'S3'    31.9720700000    -1.2070350000     -.6359280000       .0000000000
      'C4'    12.0000000000      .0878690000     -1.7138910000       .0000000000
      'N5'    14.0030700000      .9206020000     -2.5391750000       .0000000000
      'O6'    15.9949100000    -1.0625770000     1.9421980000       .0000000000


  1   2      2    3     2    6      3   4      4    5


  1   2    3      1   2    6      3   2    6      2   3    4
  3   4    5


  2   1    3    6


    1   6    0    2   3    4    0   0
    2   0    0    3   4    5    0   0


 276.


   15     5


  1   2      2    3     2    6      3   4      4    5


  1   3      1    4     1    5      1   6      2    4
  2   5      3    5     3    6      4   6      5    6
Processing of the Gaussian output matrix
Program: UNEX (all platforms)
Sometimes the force constants matrix in Gaussian's output is not correct. The correct values can be found at the end of this output, among other values. To rescue them and to form the matrix as it is needed, one calculation with UNEX must be run (F3C). F3C input is detailed below. It is necessary to have Gaussian Force Field output and the molecular formula.
BASE=BASE,<BASE>,</BASE>

F3C=mol,ARCHGAUSSIAN,syn.log
PRINT=F3CGAUSS,mol
STOP


<BASE>
molecules mol
</BASE>


<mol>
formula C2ClNOS
</mol>
After this calculation is completed, a file with extension .ks will be created. This file must be modified: Everything expects the matrix should be deleted and its extension should be change to .ccc (requited by SHRINK).
K=   1 block:
              1
     1-6.264440e-01
 K=   2 block:
              1             2
     1 1.028180e-02
     2 5.625700e-03 -2.289488e-02
 K=   3block:
              1             2             3
     1 0.000000e+00
     2 0.000000e+00  0.000000e+00
     3 5.103578e-02  8.392700e-04  0.000000e+00
 K=   4block:
……………………………………………….
Shrink
Program: SHRINK (all platforms)
This program calculates the amplitudes and anharmonic second order corrections. This information is needed to calculate the structure of the compound, and therefore, must be copied to the next input. To run this calculation, four files are needed, each with the same name but different extensions: .dat, .ffc, .ccc, and .sym. After calculating with Shrink, three different files are created; .txt, .fcl and .cor. The information needed for the refinement can be found in the .txt file:
     Program SHRINK, version 5.0
                     Adapted forMS-DOS&UNIX 30 Jan 1998
                    ***********************************
                        started 05-10-2012   at 12-19
…………………………………………..
  Amplitudes and corrections at 0276 K, second(harmonic)
    approximation, local centrifugaldistortions included;
    <dr()> are deviations fromequilibrium distances

       Atoms   Distance Amplitude <dr(loc)> <dr(har)>      K
   1  Cl1 C2   1.7357     0.0504   0.0051    0.0000   -0.00367    1
  2  C2   S3  1.7928     0.0529   -0.0028   0.0000    0.00439    2
……………………..
 14  C4   O6  3.8328     0.0708    0.0001  -0.0136    0.01484   14
 15  N5   O6  4.9006     0.0972    0.0805  -0.0541   -0.02444   15
………………………..

    Summary table including first-orderperturbation anharmonic
    and centrifugal (local (cen) and rotational(rot)) corrections;
    cubic constants from file SYN.ccc

       Atoms  Distance  <dr(har)><dr(loc)> <dr(rot)> <dr(anh)>   r_e-r_a
   1 Cl1  C2   1.7357    0.0000    0.0051    0.0004   0.0029    -0.0070
   2 C2   S3   1.7928    0.0000   -0.0028    0.0004   0.0133    -0.0093
   ………………………………………..
  14 C4   O6   3.8328   -0.0136    0.0001    0.0012   0.0166    -0.0030
  15 N5   O6   4.9006   -0.0541    0.0805    0.0020  -0.0271     0.0007

     Timeelapsed   0 hours   0 minutes  1 seconds
The first table is needed, but the two last columns must be replaced by the last column of the last table (r_e-r_a), like follows:
     Atoms    Distance  Amplitude  <dr(loc)>   <dr(har)>    r_e-r_a
  1  Cl1  C2  1.7357     0.0504     0.0051      0.0000      -0.0070
  2  C2   S3  1.7928     0.0529    -0.0028      0.0000      -0.0093
……………………..
 14  C4   O6  3.8328     0.0708     0.0001     -0.0136      -0.0030
 15  N5   O6  4.9006     0.0972     0.0805     -0.0541       0.0007
Optimization:Assembling the Z matrix
Program: GAUSSIAN (all platforms)
To get an optimized structure with Gaussian in terms of the Z matrix, it is necessary to request the results to be shown in internal coordinates.
After getting the optimized structure in terms of the Z matrix, this must be transformed into another matrix that can be processed by Unex. The main difference between these two matrix lies in the way of defining the structure. Instead of using one distance, one angle and one dihedral angle, this new matrix uses one distance and two angles. As these values correspond to two different places in the space, a + / - 1 is used to clarify the exact location of the atoms. Distances and angles should clarify which atoms are involved (B1 -> Bccl), if a distance or an angle appears twice in the Z matrix, it will be present only one time in the new matrix with the same name.
Final structure in  terms of initial Z-matrix:
 Cl
 C,1,B1
 C,2,B2,1,A1
 C,3,B3,2,A2,1,D1,0
 O,2,B4,1,A3,3,D2,0
 F,3,B5,2,A4,1,D3,0
 F,3,B6,2,A5,1,D4,0
 F,4,B7,3,A6,2,D5,0
 F,4,B8,3,A7,2,D6,0
 F,4,B9,3,A8,2,D7,0
      Variables:
 B1=1.74476391
 B2=1.53237281
 B3=1.5324864
 B4=1.18778516
 B5=1.34008696
 B6=1.34008696
 B7=1.32687018
 B8=1.32444976
 B9=1.32444976
 A1=111.08137896
 A2=112.86238993
 A3=124.08508176
 A4=109.18846746
 A5=109.18846746
 A6=108.94107242
 A7=110.21197372
 A8=110.21197372
 D1=180.
 D2=180.
 D3=-59.63758637
 D4=59.63758637
 D5=180.
 D6=60.61512831
 D7=-60.61512831


; MP2(full)/cc-pVTZ Anti
<ZMAT_MP2_anti>
 Cl
 C,1,Bccl
 C,2,Bcc1,1,Acccl
 C,3,Bcc2,2,Accc,1,D1
 O,2,Bco,1,Aoccl,3,D2
 F,3,Bcf1,2,Accf1,4,Accf2  1
 F,3,Bcf1,2,Accf1,4,Accf2 -1
 F,4,Bcf2,3,Accf3,2,D5
 F,4,Bcf3,3,Accf4,8,Afcf1 -1
 F,4,Bcf3,3,Accf4,8,Afcf1  1
      Variables:
 Bccl     1.74476391       1
 Bcc1     1.53237281       2
 Bcc2     1.5324864        2
 Bco      1.18778516       3
 Bcf1     1.34008696       4
 Bcf2     1.32687018       4
 Bcf3    1.32444976       4
 Acccl 111.08137896       5
 Accc   112.86238993       6
 Aoccl 124.08508176       7
 Accf1 109.18846746       8
 Accf2 108.190961         8
 Accf3 108.94107242       8
 Accf4 110.21197372       8
 Afcf1 108.867455         8
 D1     180.
 D2     180.
 D5     180.
</ZMAT_MP2_anti>
Refinement
Program: UNEX (all platforms)
This input must be run i times with i modifications, according to the results of the different outputs.
INPUT 1: Checking the Z Matrix
A simple calculation should be run in order to verify that the Z Matrix is well written: it must be transformed into a cartesian coordinates matrix. The STOP must be located in the place shown below. The output will provide rotational constants which must be compared with those contained in Gaussian's output, if they match, then the Z matrix used is correct.
BASE=BASE,<BASE>,</BASE>

INT=INT,<INT>,</INT>
;AVERAGE=INT,1-1,1-3
;AVERAGE=INT,2-1,2-2
;PRINT=INT
;STOP


SECTOR=R3DIV,<SEC>,</SEC>
;SECTOR=R3DIV,<SECXe>,</SECXe>


;-------------------- Static model -------------------
ZMATRIX=anti,FREEZM,<ZMAT_MP2_anti>,</ZMAT_MP2_anti>
PRINT=XYZ,anti
ZMATRIX=gauche,FREEZM,<ZMAT_MP2_gauche>,</ZMAT_MP2_gauche>
PRINT=XYZ,gauche
STOP
……………………………………………..
OUTPUT 1
Below the table the rotational constants can be found.
----------------------------------------------------------------------------------
 N | At | An|    Mass    |       X        |        Y       |         Z
 ---------------------------------------------------------------------------------
  1 Cl   17   34.96885271    0.000000000000    0.096470150575   -2.655126209599
  2 C     6   12.00000000    0.000000000000   -0.624017068605   -1.066070115990
  3 C     6   12.00000000    0.000000000000    0.450586607214    0.026355336269
  4 C     6   12.00000000  -0.000000000000  -0.138558122780    1.441071934498
  5 O     8   15.99491462  -0.000000000000  -1.794837547762   -0.866037638867
  6 F     9   18.99840320    1.092047560347    1.215531385246   -0.108272568954
  7 F     9   18.99840320  -1.092047560347   1.215531385246   -0.108272568954
  8 F     9   18.99840320    0.000000000000    0.854443163094    2.321147454455
  9 F     9   18.99840320    1.082985141076   -0.877460074686    1.629046018994
 10  F    9   18.99840320   -1.082985141076   -0.877460074686    1.629046018994
 ---------------------------------------------------------------------------------
Rotational constants (MHz):    2035.05774415      855.70333724      766.67831097

 Readingz-matrix field of gauche.
   Pure internalcoordinates z-matrix has been detected.
 ...Ok (0.02sec)
INPUT 2: Minimization of I vs s curves correponding to different measurements
It is necessary to check their quality in order to decide whether to use them or not.
BASE=BASE,<BASE>,</BASE>

INT=INT,<INT>,</INT>
;AVERAGE=INT,1-1,1-3
;AVERAGE=INT,2-1,2-2
;PRINT=INT
;STOP


SECTOR=R3DIV,<SEC>,</SEC>
;SECTOR=R3DIV,<SECXe>,</SECXe>


;-------------------- Static model -------------------
ZMATRIX=anti,FREEZM,<ZMAT_MP2_anti>,</ZMAT_MP2_anti>
PRINT=XYZ,anti
ZMATRIX=gauche,FREEZM,<ZMAT_MP2_gauche>,</ZMAT_MP2_gauche>
PRINT=XYZ,gauche
AMPLITUDES=anti,SHRINKU,<ampl_shr_b3lyp_ccpvtz_anti>,</ampl_shr_b3lyp_ccpvtz_anti>
AMPLITUDES=gauche,SHRINKU,<ampl_shr_b3lyp_ccpvtz_gauche>,</ampl_shr_b3lyp_ccpvtz_gauche>
GF=anti,AUTO,0.048572
GF=gauche,AUTO,0.048572
;-------------------- Static model -------------------


;This was just for initial run to see whether the data is o.k.
SBGL=1-1,1-2,1-3,3
SBGL=2-1,2-2,2
MINIMIZE=GEDINT,1-1,1-2,1-3,2-1,2-2
SBGL=1-1,1-2,1-3,4
SBGL=2-1,2-2,3
MINIMIZE=GEDINT,1-1,1-2,1-3,2-1,2-2
SBGL=1-1,1-2,1-3,5
SBGL=2-1,2-2,4
MINIMIZE=GEDINT,1-1,1-2,1-3,2-1,2-2
SBGL=1-1,1-2,1-3,5
SBGL=2-1,2-2,4
MINIMIZE=GEDINT,1-1,1-2,1-3,2-1,2-2
SBGL=1-1,1-2,1-3,5
SBGL=2-1,2-2,4
MINIMIZE=GEDINT,1-1,1-2,1-3,2-1,2-2
FUR=1-1,1-2,1-3,2-1,2-2
PRINT=RINT,BGL,SMS,TSMS,DSMS
STOP
OUTPUT 2
Part of the output file is shown below. Ideally, Delta curve sM (s) vs s should be smooth. If not, this curve can be taken out from the data.
GED curves.
 ------------------------------------------------------------------------------------
       S      |  Red. Int. |  Background |  Exp. sM(s) | Thr. sM(s) | Delta sM(s) |
 ------------------------------------------------------------------------------------
 ==============================================================================
 Curve: (1-1)Scale=1.000000 VarScale=No t=48.039060
             NtoP=250.000000 StoP=4.500000 Lam=0.048626 Std=None
 ==============================================================================
  6.20000000     1.36143632    0.26271102    0.61209690    0.61224259  -0.00014569
  6.40000000     1.33107388    0.26209839    0.44144317    0.40658817    0.03485500
  6.60000000     1.30076861    0.26148576    0.25926686    0.21245131    0.04681555
  6.80000000     1.27522225    0.26087876    0.09753573    0.05953838    0.03799736
  7.00000000     1.26072852    0.26028783    0.00308486  -0.05203345    0.05511831
....................................................................................
 34.00000000     1.62673940    0.62632387    0.01412801    0.09058402  -0.07645602
 34.20000000     1.62972109    0.63001599  -0.01008571    0.09324709   -0.10333280
 ==============================================================================
 Curve: (1-2)Scale=1.000000 VarScale=No t=123.311229
             NtoP=250.000000 StoP=4.500000 Lam=0.048626 Std=None
 ==============================================================================
  6.20000000     1.14524757    0.05029772    0.58868907    0.61224259  -0.02355352
  6.40000000     1.11359300    0.05045794    0.40406437    0.40658817  -0.00252380
INPUT 3: Processing the data column that is imported from Shrink
The new column must have the values in increasing inter-nuclear values.
BASE=BASE,<BASE>,</BASE>

INT=INT,<INT>,</INT>
;AVERAGE=INT,1-1,1-3
;AVERAGE=INT,2-1,2-2
;PRINT=INT
;STOP


SECTOR=R3DIV,<SEC>,</SEC>
;SECTOR=R3DIV,<SECXe>,</SECXe>


;-------------------- Static model -------------------
ZMATRIX=anti,FREEZM,<ZMAT_MP2_anti>,</ZMAT_MP2_anti>
PRINT=XYZ,anti
ZMATRIX=gauche,FREEZM,<ZMAT_MP2_gauche>,</ZMAT_MP2_gauche>
PRINT=XYZ,gauche
AMPLITUDES=anti,SHRINKU,<ampl_shr_b3lyp_ccpvtz_anti>,</ampl_shr_b3lyp_ccpvtz_anti>
PRINT=RSORTU,anti
AMPLITUDES=gauche,SHRINKU,<ampl_shr_b3lyp_ccpvtz_gauche>,</ampl_shr_b3lyp_ccpvtz_gauche>
PRINT=RSORTU,gauche
STOP
OUTPUT 3
The table obtained from the output is shown below.
<anti>
;--------------------------------------------------------------
;A1  A2     Comm(r)        U         Corr         A         G
;--------------------------------------------------------------
C2   O5    1.191285    0.036300   -0.003500  0.000000      0
C4   F9    1.330350    0.044800   -0.005900  0.000000      0
...............................................................
O5   F8    4.171895    0.097800   -0.027400  0.000000      0
Cl1  F10   4.516889    0.184800    0.008100  0.000000      0
Cl1  F9    4.516889    0.184800    0.008100  0.000000      0
Cl1  F8     5.039369   0.089800   -0.005700   0.000000     0
;--------------------------------------------------------------
</anti>
MODIFIED INPUT 3
INT=INT,<INT>,</INT>
;AVERAGE=INT,1-1,1-3
;AVERAGE=INT,2-1,2-2
;PRINT=INT
;STOP


SECTOR=R3DIV,<SEC>,</SEC>
;SECTOR=R3DIV,<SECXe>,</SECXe>


;-------------------- Static model -------------------
ZMATRIX=anti,FREEZM,<ZMAT_MP2_anti>,</ZMAT_MP2_anti>
PRINT=XYZ,anti
ZMATRIX=gauche,FREEZM,<ZMAT_MP2_gauche>,</ZMAT_MP2_gauche>
PRINT=XYZ,gauche
;AMPLITUDES=anti,SHRINKU,<ampl_shr_b3lyp_ccpvtz_anti>,</ampl_shr_b3lyp_ccpvtz_anti>
;PRINT=RSORTU,anti
AMPLITUDES=anti,FREEU,<ampl_anharm_b3lyp_6-31Gd_anti>,</ampl_anharm_b3lyp_6-31Gd_anti>
;AMPLITUDES=gauche,SHRINKU,<ampl_shr_b3lyp_ccpvtz_gauche>,</ampl_shr_b3lyp_ccpvtz_gauche>
;PRINT=RSORTU,gauche
AMPLITUDES=gauche,FREEU,<ampl_anharm_b3lyp_6-31Gd_gauche>,</ampl_anharm_b3lyp_6-31Gd_gauche>
...............................................................
</ampl_anharm_b3lyp_6-31Gd_anti>
;--------------------------------------------------------------
;A1  A2     Comm(r)        U         Corr         A         G
;--------------------------------------------------------------
C2   O5    1.191285    0.036300   -0.003500  0.000000      0
C4   F9    1.330350    0.044800   -0.005900  0.000000      0
...............................................................
O5   F8    4.171895    0.097800   -0.027400  0.000000      0
Cl1  F10   4.516889    0.184800    0.008100  0.000000      0
Cl1  F9    4.516889    0.184800    0.008100  0.000000      0
Cl1  F8     5.039369   0.089800   -0.005700   0.000000     0
;--------------------------------------------------------------
</ampl_anharm_b3lyp_6-31Gd_anti>
INPUT 4: Average between all I vs s curves for short and long NP distances
BASE=BASE,<BASE>,</BASE>

INT=INT,<INT>,</INT>
AVERAGE=INT,1-1,1-3
AVERAGE=INT,2-1,2-2
PRINT=INT
STOP
MODIFIED INPUT 4
===================================================================
 Curve: (3-1)  Scale=1.000000 VarScale=No t=0.000000
               NtoP=250.000000 StoP=4.500000 Lam=0.048626 Std=None
 ==================================================================
    6.20000000     2.50007209
    6.40000000     2.37592964
............................
   34.00000000     0.81695738
   34.20000000     0.81687515
 ===================================================================
 Curve: (4-1)  Scale=1.000000 VarScale=No t=0.000000
               NtoP=500.000000 StoP=4.500000 Lam=0.048518 Std=None
 ===================================================================
    2.20000000    18.35742906
............................
   17.20000000    14.06039435
   17.40000000    13.91526853
 ----------------------------

</INT>
.........................
    17.2000000000        13.9334369997
    17.4000000000        13.7750708402
INT2   Lam=0.048518  NtoP=500.0  StoP=4.5   VarSc=0
     2.2000000000         2.1177810132
     2.4000000000         2.1415564705
.........................
    17.0000000000         1.6796088426
    17.4000000000         1.6455689055
INT3   Lam=0.048626  NtoP=250.0  StoP=4.5   VarSc=0
; Average of 1-1 and 1-3. 1-2 rejected due to  outliers at s=19.2
    6.20000000     2.50007209
...............................
;   34.00000000     0.81695738
;   34.20000000     0.81687515
INT4   Lam=0.048518  NtoP=500.0  StoP=4.5   VarSc=0
; Average of 2-1 and 2-2
    2.20000000    18.35742906
............................
   17.20000000    14.06039435
  </INT>
INPUT 5: Minimization of the s vs I avaraged curves
This is the final input. The STOP must be after the optimization in order to get the optimized structure.
BASE=BASE,<BASE>,</BASE>

INT=INT,<INT>,</INT>
;AVERAGE=INT,1-1,1-3
;AVERAGE=INT,2-1,2-2
;PRINT=INT
;STOP


SECTOR=R3DIV,<SEC>,</SEC>
;SECTOR=R3DIV,<SECXe>,</SECXe>


;-------------------- Static model -------------------
ZMATRIX=anti,FREEZM,<ZMAT_MP2_anti>,</ZMAT_MP2_anti>
PRINT=XYZ,anti
ZMATRIX=gauche,FREEZM,<ZMAT_MP2_gauche>,</ZMAT_MP2_gauche>
PRINT=XYZ,gauche
AMPLITUDES=anti,SHRINKU,<ampl_shr_b3lyp_ccpvtz_anti>,</ampl_shr_b3lyp_ccpvtz_anti>
AMPLITUDES=gauche,SHRINKU,<ampl_shr_b3lyp_ccpvtz_gauche>,</ampl_shr_b3lyp_ccpvtz_gauche>
GF=anti,AUTO,0.048572
GF=gauche,AUTO,0.048572
;-------------------- Static model -------------------

; This was just for initial run to see whether thedata is o.k.
;SBGL=1-1,1-2,1-3,3
;SBGL=2-1,2-2,2
;MINIMIZE=GEDINT,1-1,1-2,1-3,2-1,2-2
....................
;SBGL=1-1,1-2,1-3,5
;SBGL=2-1,2-2,4
;MINIMIZE=GEDINT,1-1,1-2,1-3,2-1,2-2
;FUR=1-1,1-2,1-3,2-1,2-2
;PRINT=RINT,BGL,SMS,TSMS,DSMS
;STOP

SBGL=3-1,3
SBGL=4-1,2
MINIMIZE=GEDINT,3-1,4-1
SBGL=3-1,4
SBGL=4-1,3
MINIMIZE=GEDINT,3-1,4-1
SBGL=3-1,5
SBGL=4-1,4
MINIMIZE=GEDINT,3-1,4-1
SBGL=3-1,5
SBGL=4-1,4
MINIMIZE=GEDINT,3-1,4-1

AMPLGROUP=anti,100,   0.0,2.0, 2.0,2.5, 2.5,3.1, 3.1,4.0, 4.0,4.3,4.3,4.8, 4.8,6.0
AMPLGROUP=gauche,100,0.0,2.0, 2.0,2.5, 2.5,3.1, 3.1,4.0, 4.0,4.3, 4.3,4.8, 4.8,6.0

SBGL=3-1,5
SBGL=4-1,4
MINIMIZE=GEDINT,3-1,4-1

.................

SBGL=3-1,5
SBGL=4-1,4
MINIMIZE=GEDINT,3-1,4-1

FUR=3-1,4-1

SBGL=1-1,1-3,5
SBGL=2-1,2-2,4
AVERAGE=SMS,1-1,1-3
AVERAGE=SMS,2-1,2-2

PRINT=RINT,BGL,SMS,TSMS,DSMS

PRINT=GRAPHTERMS,anti
PRINT=GRAPHTERMS,gauche

PRINT=XYZ,anti
PRINT=XYZ,gauche

PRINT=TERMS,anti
PRINT=TERMS,gauche

PRINT=ALLGEOM,anti
PRINT=ALLGEOM,gauche

STOP


<BASE>
molecules anti,gauche
PrintMainInertXYZ=1
GedVarAmplScale=1
</BASE>


<anti>
 formula C3ClF5O
 amount 0.5
 varx 99
</anti>

<gauche>
 formula C3ClF5O
</gauche>


; MP2(full)/cc-pVTZ Anti
<ZMAT_MP2_anti>
 Cl
 C,1,Bccl
 C,2,Bcc1,1,Acccl
 C,3,Bcc2,2,Accc,1,D1
 O,2,Bco,1,Aoccl,3,D2
 F,3,Bcf1,2,Accf1,4,Accf2  1
 F,3,Bcf1,2,Accf1,4,Accf2 -1
 F,4,Bcf2,3,Accf3,2,D5
 F,4,Bcf3,3,Accf4,8,Afcf1 -1
 F,4,Bcf3,3,Accf4,8,Afcf1  1
      Variables:
 Bccl    1.74476391       1
 Bcc1    1.53237281       2
 Bcc2    1.5324864        2
 Bco     1.18778516       3
 Bcf1    1.34008696       4
 Bcf2    1.32687018       4
 Bcf3    1.32444976       4
 Acccl 111.08137896       5
 Accc  112.86238993       6
 Aoccl124.08508176       7
 Accf1109.18846746       8
 Accf2108.190961         8
 Accf3108.94107242       8
 Accf4110.21197372       8
 Afcf1108.867455         8
 D1    180.
 D2    180.
 D5    180.
</ZMAT_MP2_anti>

; MP2(full)/cc-pVTZ Gauche
<ZMAT_MP2_gauche>
 Cl
 C,1,Bccl
 C,2,Bcc1,1,Acccl
 C,3,Bcc2,2,Accc,1,D1
 O,2,Bco,1,Aoccl,3,D2
 F,3,Bcf1,2,Accf1,4,Accf2  1
 F,3,Bcf2,2,Accf3,4,Accf4 -1
 F,4,Bcf3,3,Accf5,2,D5
 F,4,Bcf4,3,Accf6,8,Afcf1 -1
 F,4,Bcf5,3,Accf7,8,Afcf2  1
      Variables:
 Bccl    1.74104544       1
 Bcc1    1.53844295       2
 Bcc2    1.53375348       2
 Bco     1.1875937        3
 Bcf1    1.33731261       4
 Bcf2    1.33768028       4
 Bcf3    1.3231098        4
 Bcf4    1.326444         4
 Bcf5    1.32712656       4
 Acccl113.62935363       5
 Accc  111.66835847       6
 Aoccl124.12078587       7
 Accf1108.05345711       8
 Accf2107.890004         8
 Accf3111.47049197       8
 Accf4108.478799         8
 Accf5109.72468255       8
 Accf6109.62189068       8
 Accf7110.12619315       8
 Afcf1109.259023         8
 Afcf2109.096488         8
 D1     88.38354397       9
 D2    179.14837657
 D5    176.85657185
</ZMAT_MP2_gauche>


<ampl_shr_b3lyp_ccpvtz_anti>
   1  Cl1 C2   1.7737     0.0529   0.0004    0.0000    -0.0074
   2  C2  C3   1.5515     0.0527   0.0014    0.0000    -0.0115
................................................................
  44  F8  F10  2.1686     0.0553   0.0015   -0.0021    -0.0072
  45  F9  F10  2.1771     0.0556   0.0016   -0.0022    -0.0068
</ampl_shr_b3lyp_ccpvtz_anti>


<ampl_shr_b3lyp_ccpvtz_gauche>
   1  Cl1 C2   1.7701     0.0526   0.0005    0.0000   -0.0082
   2  C2  C3   1.5584     0.0534   0.0015    0.0000   -0.0066
...............................................................
  44  F8  F10  2.1708     0.0554   0.0017   -0.0024   -0.0588
  45  F9  F10  2.1718     0.0555   0.0016   -0.0023   -0.0577
</ampl_shr_b3lyp_ccpvtz_gauche>


<INT>
INT1 Lam=0.048626  NtoP=250.0  StoP=4.5 VarSc=0
   6.2000000000       2.4670630968
   6.4000000000       2.3500414451
....................................
  34.0000000000       0.8452309648
  34.2000000000       0.8465918172
INT1 Lam=0.048626  NtoP=250.0  StoP=4.5 VarSc=0
   6.2000000000       5.3270948007
   6.4000000000       5.0467056543
....................................
  34.2000000000       1.6253768659
INT1 Lam=0.048626  NtoP=250.0  StoP=4.5 VarSc=0
   6.2000000000       4.2196300118
   6.4000000000       4.0009704707
....................................
  34.0000000000       1.3137967825
  34.2000000000       1.3112559257
INT2 Lam=0.048518  NtoP=500.0  StoP=4.5 VarSc=0
   2.2000000000      18.6260382535
   2.4000000000      18.9079095988
.....................................
  17.2000000000      13.9334369997
  17.4000000000      13.7750708402
INT2  Lam=0.048518  NtoP=500.0 StoP=4.5  VarSc=0
   2.2000000000       2.1177810132
   2.4000000000       2.1415564705
....................................
  17.2000000000       1.6610096350
  17.4000000000       1.6455689055
INT3 Lam=0.048626  NtoP=250.0  StoP=4.5 VarSc=0
; Average of 1-1 and 1-3. 1-2 rejected due to outliersat s=19.2
  6.20000000     2.50007209
  6.40000000     2.37592964
  6.60000000     2.26486102
.................................
; 33.80000000     0.81776311
; 34.00000000     0.81695738
; 34.20000000     0.81687515
INT4 Lam=0.048518  NtoP=500.0  StoP=4.5 VarSc=0
; Average of 2-1 and 2-2
  2.20000000    18.35742906
  2.40000000    18.59990260
  2.60000000    19.41286370
  2.80000000    20.17333255
.................................
 17.40000000    13.91526853
</INT>


; Reduced sector function from Xe data.
<SECXe>
8.250       1.8684053318
.............................
68.250            0.7826424866
</SECXe>


; Reduced sector function estimated from C6H6 standards
<SEC>
    8.126200     1.959824
    8.869450     1.634186
 ..........................
   67.388000     0.787889
</SEC>
OUTPUT 5
This output shows different curves under the sentence: GED curves.
Estimated parameters info:
 -----------------------------------------------------------------------------
  Group   Def.  Old Value     Value     3*Sigma   Error,%  d(X^2)/dA    Pr
 -----------------------------------------------------------------------------
   99     Xmol   0.382714    0.382541   0.069244 18.10102   -0.00000  0.7615
    1        R   1.756618    1.756594   0.006567  0.37386   -0.00000  0.9998
    2        R   1.563288    1.563270   0.004433  0.28357    0.00000  0.9999
    3        R   1.177490    1.177501   0.006483  0.55055    0.00000  0.9997
    4        R   1.321312    1.321311   0.001921  0.14538    0.00000  1.0000
    5      Ang 109.892096  109.894287   0.826871  0.75242   -0.00000  0.9994
    6      Ang 112.159157  112.154864   0.954999  0.85150    0.00000  0.9992
    7      Ang 125.112335  125.116783   0.785255  0.62762   -0.00000  0.9996
    8      Ang 109.114177  109.114803   0.158302  0.14508    0.00000  1.0000
    9        F  86.791469   86.793834   5.635761  6.49327   -0.00000  0.9564
 -----------------------------------------------------------------------------

.....................................................

 Radialdistribution curve:
 -----------------------------------------------------
        R   | Experimental  |  Theoretical |  Delta
 -----------------------------------------------------
     0.0000      0.0000          0.0000       0.0000
     0.0201     -0.0004         -0.0004      -0.0000
     0.0401     -0.0012         -0.0011      -0.0000
........................................................
     6.0589      0.3608          0.5166      -0.1557
     6.0789      0.3349          0.5220      -0.1871
 -----------------------------------------------------------------

 ------------------------------------------------------------------------------
..................................................................................

 GED curves.
 ------------------------------------------------------------------------------------
       S      |  Red. Int. |  Background |  Exp. sM(s) | Thr. sM(s) | Delta sM(s) |
 ------------------------------------------------------------------------------------
 ==============================================================================
 Curve: (1-1)Scale=1.000000 VarScale=No t=48.115215
             NtoP=250.000000 StoP=4.500000 Lam=0.048626 Std=None
 ==============================================================================
  6.20000000     1.35928148    0.26106147    0.60896407    0.60895866    0.00000541
........................................................................................
 33.80000000     1.62231851    0.62016229    0.07288034    0.08537004  -0.01248970
 34.00000000     1.62416465    0.62386123    0.01031637    0.08826464  -0.07794828
 34.20000000     1.62714161    0.62756016  -0.01431441    0.09201589   -0.10633030
 ==============================================================================
 Curve: (1-2)Scale=1.000000 VarScale=No t=0.000000
             NtoP=250.000000 StoP=4.500000 Lam=0.048626 Std=None
 ==============================================================================
 ==============================================================================
 Curve: (1-3)Scale=1.000000 VarScale=No t=90.501824
             NtoP=250.000000 StoP=4.500000 Lam=0.048626 Std=None
 ==============================================================================
 ==============================================================================
 Curve: (2-1)Scale=1.000000 VarScale=No t=95.129985
             NtoP=500.000000 StoP=4.500000 Lam=0.048518 Std=None
 ==============================================================================
 ==============================================================================
 Curve: (2-2)Scale=1.000000 VarScale=No t=10.903609
             NtoP=500.000000 StoP=4.500000 Lam=0.048518 Std=None
 ==============================================================================
 ==============================================================================
 Curve: (3-1)Scale=1.000000 VarScale=No t=55.707169
             NtoP=250.000000 StoP=4.500000 Lam=0.048626 Std=None
 ==============================================================================
  6.20000000     1.18974264    0.09815282    0.56785683    0.60895866  -0.04110183
....................................................................................
 32.20000000     1.33554786    0.33590566  -0.01152121   -0.04256328    0.03104207
 32.40000000     1.33851692    0.33805072    0.01510508    0.01213397    0.00297111
 ==============================================================================
 Curve: (4-1)Scale=1.000000 VarScale=No t=94.131818
             NtoP=500.000000 StoP=4.500000 Lam=0.048518 Std=None
 ==============================================================================
  2.20000000     0.78504878   -0.05411432  -0.35384119   -0.38421120    0.03037002
  2.40000000     0.84269642   -0.05543783  -0.24447782   -0.25029263    0.00581481
.....................................................................................
 17.20000000     1.09913867    0.10858912  -0.16254779   -0.16326316    0.00071537
 17.40000000     1.08931810    0.10665971  -0.30174395   -0.25433031   -0.04741364
 ==============================================================================
 Curve: (5-1)Scale=1.000000 VarScale=Yes t=0.000000
             NtoP=0.000000 StoP=0.000000 Lam=0.000000 Std=CCl4
 ==============================================================================
 ==============================================================================
 Curve: (6-1)Scale=1.000000 VarScale=Yes t=0.000000
             NtoP=0.000000 StoP=0.000000 Lam=0.000000 Std=CCl4
 ==============================================================================
 ------------------------------------------------------------------------------------

 ------------------------------------------------------------------

 anti> Cartesian coordinatesof all atoms (Angstroms) in principal axes:
 ----------------------------------------------------------------------------------
 N | At | An|    Mass    |       X        |        Y       |         Z
 ----------------------------------------------------------------------------------
  1 Cl   17   34.96885271  -0.000000000000   0.098891726461   -2.673655714154
  2 C     6   12.00000000  -0.000000000000  -0.642505379264   -1.081188090272
  3 C     6   12.00000000    0.000000000000    0.465604459592    0.021493654044
  4 C     6   12.00000000  -0.000000000000  -0.137827149558    1.463727994910
  5 O     8   15.99491462  -0.000000000000  -1.801571971574   -0.873646688751
  6 F     9   18.99840320    1.083738081654    1.209499145641   -0.112654198390
  7 F     9   18.99840320  -1.083738081654   1.209499145641   -0.112654198390
  8 F     9   18.99840320    0.000000000000    0.840789636905    2.331725742942
  9 F     9   18.99840320    1.070014290392   -0.863129616109    1.647549208448
 10  F    9   18.99840320   -1.070014290392   -0.863129616109    1.647549208448
 ----------------------------------------------------------------------------------
 Rotationalconstants (MHz):    2058.63197637      846.57467555      758.59858625


 gauche> Cartesian coordinatesof all atoms (Angstroms) in principal axes:
 ----------------------------------------------------------------------------------
 N | At | An|    Mass    |       X        |        Y       |         Z
 ----------------------------------------------------------------------------------
  1 Cl   17   34.96885271  -0.057539155306   0.783669581995    2.248254364820
  2 C     6   12.00000000    0.302181032032   -0.560832392096    1.182661209749
  3 C     6   12.00000000  -0.496292290803  -0.486393465356   -0.166312114853
  4 C     6   12.00000000    0.269764557544    0.376188159897   -1.223309237137
  5 O     8   15.99491462    1.063357253184   -1.427554777940    1.418162829543
  6 F     9   18.99840320  -0.602069962784  -1.710505809340   -0.644746406136
  7 F     9   18.99840320  -1.693057952110   0.038702190611    0.011270344024
  8 F     9   18.99840320  -0.381920474140   0.366127741793   -2.353128952568
  9 F     9   18.99840320    1.464160913810   -0.121730498270   -1.411698391884
 10  F    9   18.99840320    0.375760815244    1.610687198306   -0.803120437831
 ----------------------------------------------------------------------------------
 Rotationalconstants (MHz):    1680.30127114      939.60226915      875.37870851


 GED terms listof molecule anti
 Terms sorted inorder of increasing of r_a.
 -------------------------------------------------------------------------
  At1 At2      r_a          l         corr         a           Gr      Gu
 -------------------------------------------------------------------------
  C2  O5    1.181001    0.036300  -0.003500   0.000000        0      0
  C4  F10   1.311574    0.044800  -0.005900   0.000000        0      0
..........................................................................
  Cl1 F9    4.546373    0.184800   0.008100   0.000000        0      0
  Cl1 F8    5.065765    0.089800  -0.005700   0.000000        0      0
 -------------------------------------------------------------------------


 GED terms listof molecule gauche
 Terms sorted inorder of increasing of r_a.
 -------------------------------------------------------------------------
  At1  At2     r_a          l         corr         a           Gr      Gu
 -------------------------------------------------------------------------
  C2   O5   1.181210    0.036400   -0.003900  0.000000        0       0
  C3   F6   1.326937    0.045000   -0.008400  0.000000        0       0
..........................................................................
  Cl1  F8   4.613062    0.169100    0.018600  0.000000        0       0
 -------------------------------------------------------------------------


 anti> All internalgeometrical parameters.
 Errors are 1.000000 times standard deviations.
 -----------------------------------------------------------------------
  No.  Type     i    j    k   l    a-Value  g-Value c-Value    Error
 -----------------------------------------------------------------------
    1stretch    1    2   0    0    1.76399 1.76558  1.75659   0.00219
.........................................................................
   23 bend       8   4   10    0                    108.79379   0.05277
........................................................................
   38torsion    9    4   3    7                   -178.85884   0.19849
   39torsion   10    4   3    7                     59.55223   0.30163
   40 o.o.p      5   1    2    3                     -0.00000   0.00000
   41 o.o.p      1   3    2    5                     -0.00000   0.00000
 -----------------------------------------------------------------------


 gauche> All internalgeometrical parameters.
 Errors are 1.000000 times standard deviations.
 -----------------------------------------------------------------------
  No.  Type     i    j    k   l    a-Value  g-Value c-Value    Error
 -----------------------------------------------------------------------
    1stretch    1    2   0    0    1.76108 1.76265  1.75288   0.00219
.........................................................................
   11 bend       1   2    5    0                    125.15249   0.26175
........................................................................
   39torsion   10    4   3    7                     59.40572   0.30886
   40 o.o.p      5   1    2    3                     -0.69630   0.00224
   41 o.o.p      1   3    2    5                     -0.76222   0.00604
 -----------------------------------------------------------------------
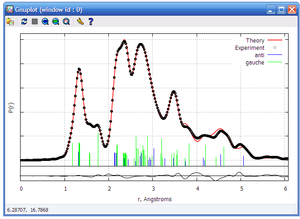
It is possible to visualized the radial distribution curves by using the sentence: furplot "inputsname.inp_i.ks"
About the programs
UNEX and UNEX 2.0
- Both programs can be executed from cmd.exe
- To run one input: unex "inputsname".inp
- To open pictures: furplot "filename".extension
- To open inputs or outputs: edit "filename".extension
- To stop one calculation: ctrl+c
- Input's extension: .inp
- Output's extension: .ks
- ; before one sentence means that it wont be executed
- The order of the sentences is important, not the order of the data.
Shrink
See reference [1].
References
[1] User´s Guide to the Shrink program.
